In Alberta’s oil and gas industry, real-time data visibility is critical for operational efficiency and safety. A React-based dashboard empowers engineers and managers to monitor field devices, pipelines, and sensors instantly through a modern web interface. By connecting IoT-enabled equipment to the dashboard, companies can visualize temperature, pressure, vibration, and flow rate trends as they happen — helping detect anomalies, optimize production, and reduce costly downtime. Its responsiveness and scalability make React an ideal choice for complex, data-heavy industrial environments. Moreover, a React dashboard allows seamless integration between edge devices, cloud platforms, and analytics tools, creating a unified control center for distributed oil operations. Whether it’s monitoring wellhead performance or managing predictive maintenance alerts, the dashboard’s modular and interactive design ensures decision-makers always have access to actionable insights — anywhere, on any device. For Alberta’s energy sector, where precision, uptime, and environmental compliance are paramount, a React-driven IoT dashboard isn’t just a tech upgrade — it’s a strategic advantage for the digital oilfield of the future.
This blog illustrate how to integrate firmware data directly into a modern frontend UI.
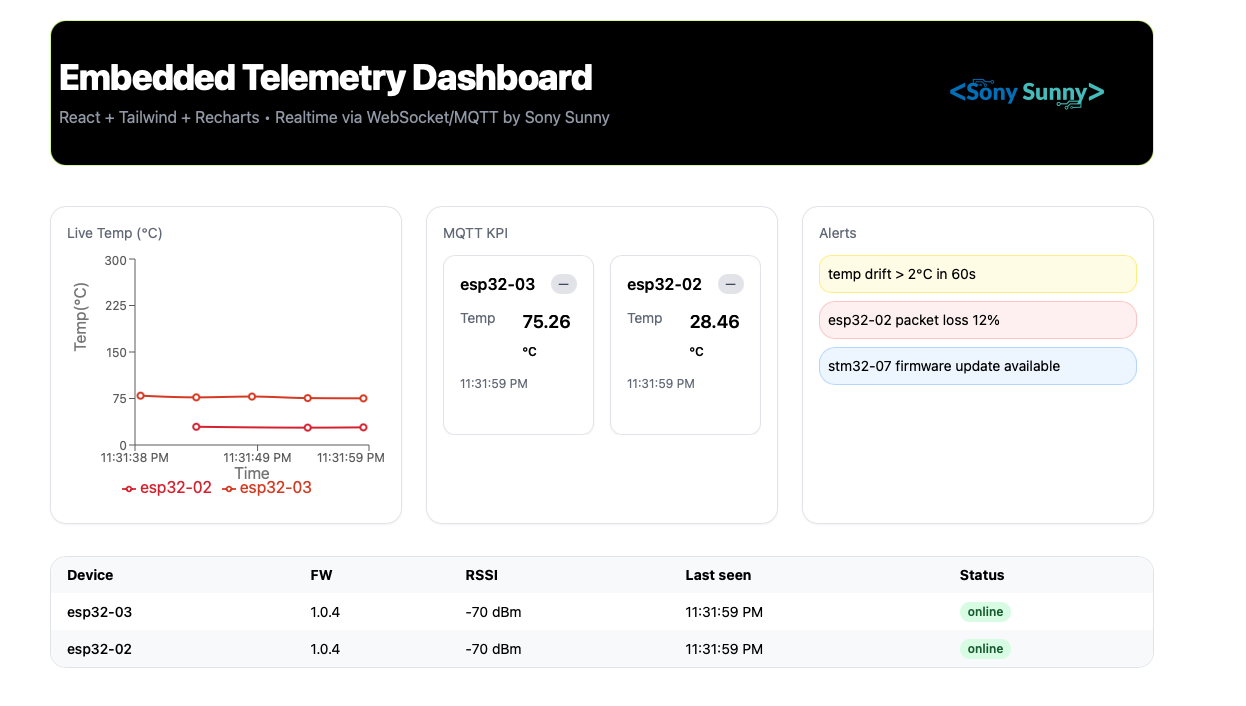
Dashboard
🔌 Real-time Data Flow
Each device (like an ESP32) publishes telemetry data to a topic such as:
{
  "deviceId": "esp32-03",
  "ts": 1730006401223,
  "sensors": { "temp_c": 78.34 }
}
The React dashboard subscribes to a wildcard topic:
NEXT_PUBLIC_MQTT_URL=ws://test.mosquitto.org:8080/mqtt
NEXT_PUBLIC_MQTT_TOPIC=plant/lineA/st1/+/telemetry
Whenever a device sends data, it appears instantly in the dashboard table and live chart.
💻 Live Temperature Chart
We used Recharts for smooth, responsive plotting. Each device is assigned a unique color when it first sends data, helping you visually distinguish temperature trends over time.
Key Features
- 📡 Live MQTT updates using WebSockets
- 🌈 Dynamic color assignment per device
- 📈 Smooth chart rendering with LineChart from Recharts
- ⏱️ 2-minute rolling buffer for recent telemetry
- 💾 Lightweight React + Tailwind stack
📊 Device Table + Chart Integration
The dashboard displays:
- Device Table — firmware version, RSSI, last seen time, and status.
- Live Temperature Chart — streaming temperature updates for each device in real time. The system automatically adds new rows and chart lines as new devices join the network — no refresh needed.
🎬 Demo Video
Here’s a short demo showing multiple ESP32 devices streaming live data to the dashboard via MQTT:
🧠 How It Works
Devices publish telemetry to the Mosquitto test broker. The React app (Next.js + MQTT.js) subscribes to the same topic. Each message updates the device store and chart buffer in milliseconds. A unique random color is assigned per device and reused during that session.
🧩 Code Preview
// Each new device that sends data gets a stable color and a live line in the chart
<Line
  key={id}
  name={id}
  dataKey={id}
  type="monotone"
  stroke={getDeviceColor(id)}
  strokeWidth={2}
  dot
  connectNulls
  isAnimationActive={false}
/>
Each new device that sends data triggers getDeviceColor(id) → generating a random hue via HSL, ensuring visually distinct lines.
🌍 Deployment Ready
The dashboard runs perfectly on any MQTT broker supporting WebSockets. For production, you can host it on Vercel, connect to HiveMQ Cloud, or deploy your own Mosquitto broker.
🚀 Conclusion
This dashboard brings your IoT devices to life — literally. Every second, new telemetry flows in, visualized in real time with a modern web UI. If you’re building scalable IoT ecosystems, this dashboard is a perfect starting point.